Back
16 Mar 2020
US Dollar Index Price Analysis: DXY holds on above 98.00 figure despite 100bps Fed’s cut
- DXY trades near the March’s highs despite the exceptional Fed’s intervention of cutting rates by 100bps.
- Key resistance is seen at the 98.75 level.
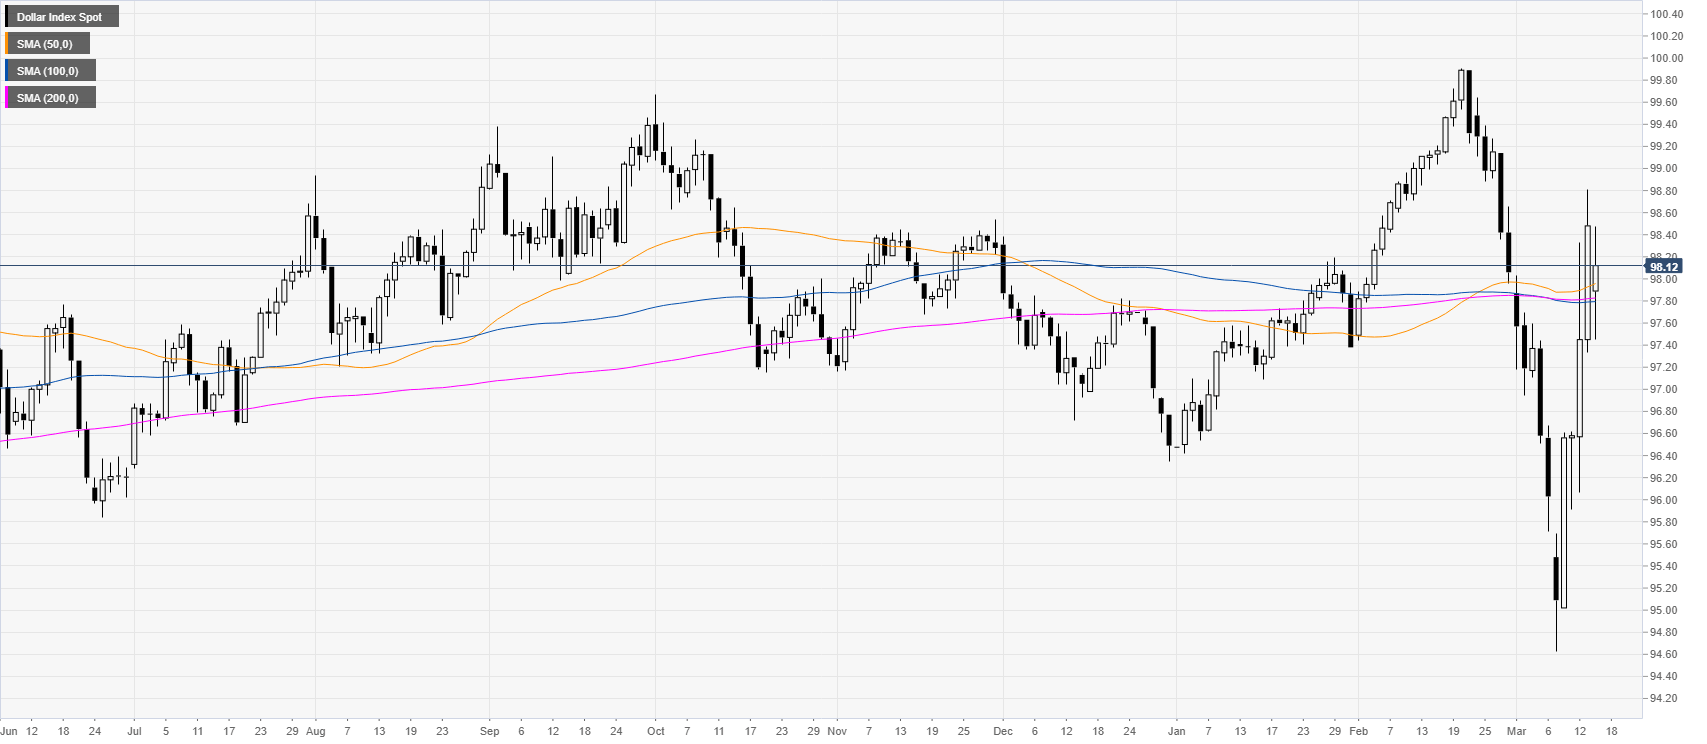
DXY daily chart
Two weeks ago DXY (US dollar index) suffered a dramatic decline which was then followed last week by the best weekly advance since October 2008. Volatility remains extremely high amidst stock market turmoil. DXY remains supported despite the 100bps cut from the Fed.
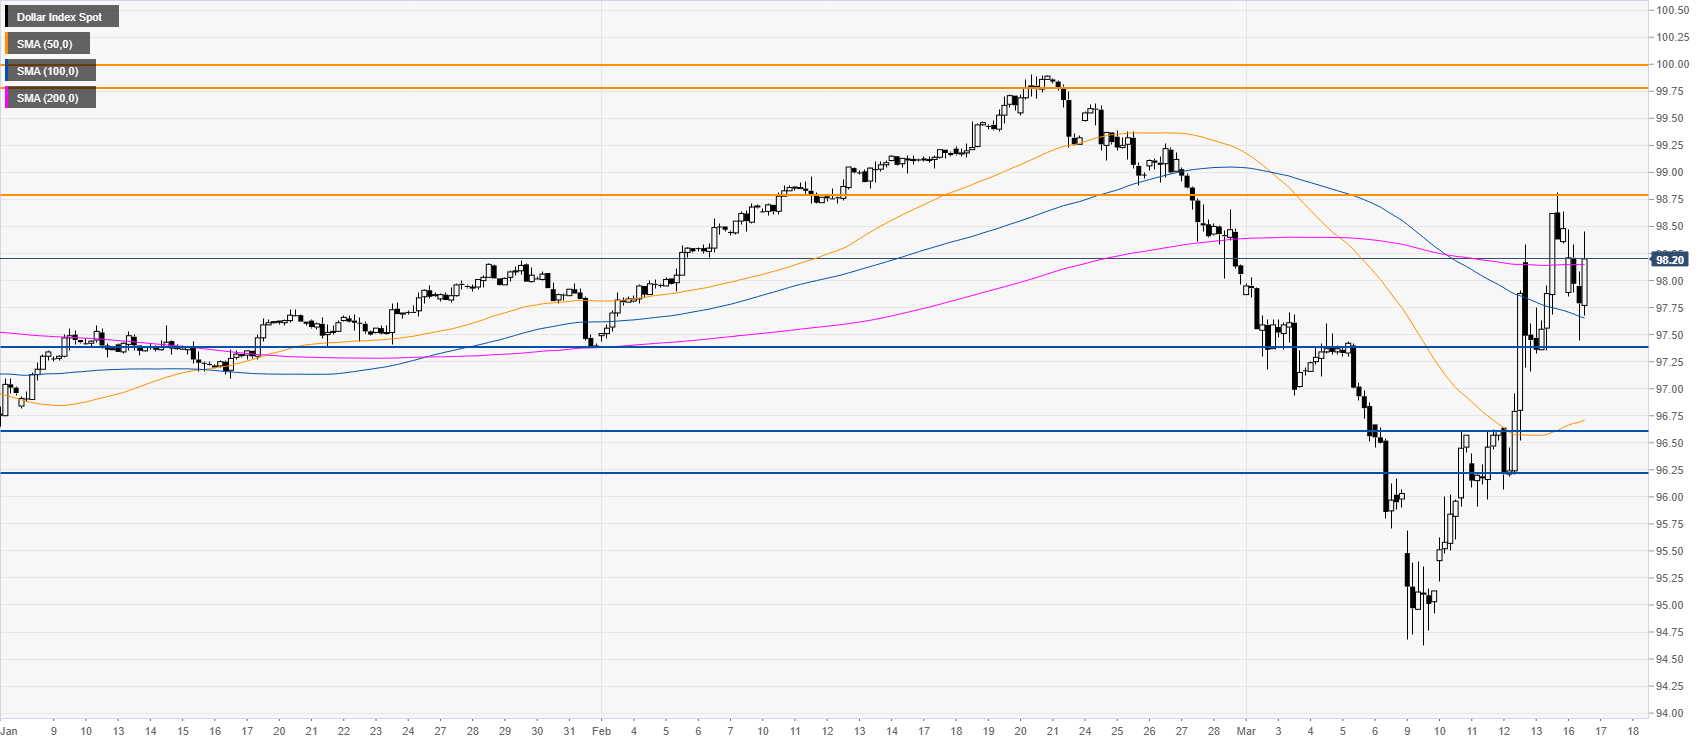
DXY four-hour chart
DXY is consolidating gains near the 200 SMA after last week’s rally. The bulls remain in control and a break above the 98.75 level could potentially send DXY to the 99.75/100.00 resistance zone in the coming sessions.
Additional key levels