Back
24 Feb 2020
Gold Price Analysis: All eyes on $1696 amid bullish MACD
- Gold prices remain positive above March 2013 top.
- The year 2013 high and late-2012 tops will be on the bull’s radar for now.
- Overbought RSI can trigger intermediate pullbacks but major sellers will stay away unless prices dip below September 2019 peak.
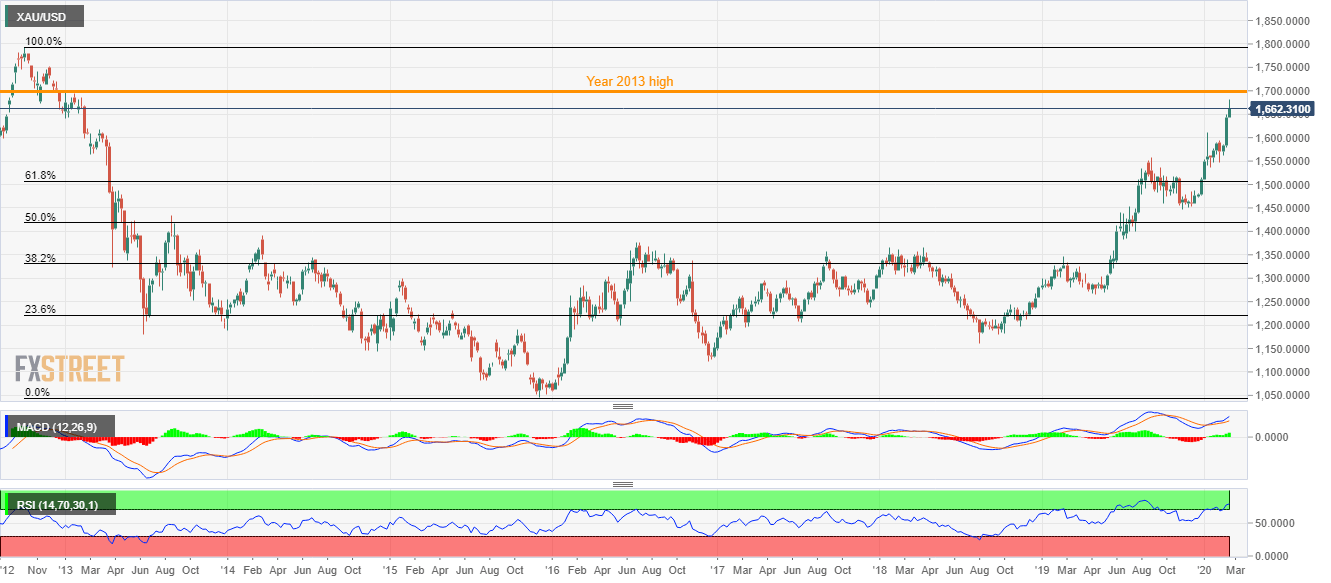
Gold prices rise 1.2% to $1,662 by the press time of the pre-European session on Monday. In doing so, the bullion stays positive above March 2013 top while also challenging the year 2013 high.
Following the metal’s sustained run-up beyond $1,696, high of 2013, highs marked during November and October 2012, respectively near $1,751 and $1,794 can please the bulls.
On the contrary, overbought RSI conditions favor a pullback to March 2013 top near $1,617. Though further declines seem doubtful as $1,600 and September 2019 top close to $1,557 will challenge the bears afterward.
Also likely to question the sellers below $1,600 will be 61.8% Fibonacci retracement of gold’s broad declines between October 2012 and November 2015.
Gold weekly chart
Trend: Bullish