USD/CAD Technical Analysis: Pulls back from 21-day SMA after Friday’s ‘hanging man’ on D1
- USD/CAD drops after marking a trend reversal formation on the previous day, the pair rose for three consecutive days before that.
- 1.3000 round figure offers immediate support whereas the Bulls can look for 1.3270/75 during the sustained rise.
USD/CAD drops to 1.3050 ahead of the European session on Monday. In doing so, the pair extends its pullback from 21-day SMA. The pair formed a trend-reversal candlestick pattern on the daily (D1) chart on Friday.
Considering the pair’s pullback from near-term key SMA and a bearish candlestick pattern, as the prices rose ahead of the formation, the quote is likely to witness further downside.
In doing so, 1.3000 and the monthly bottom surrounding 1.2940 will become immediate supports to watch during additional declines.
Should USD/CAD prices fail to bounce off 1.2940, 1.2900 and October 2018 low near 1.2780 will gain the Bears’ attention.
Meanwhile, pair’s rise past-1.3100 will negate the candlestick pattern and can propel the quote towards 1.3200, 1.3225/30 resistances.
However, a horizontal-line since mid-November signifies the importance of 1.3270/75 as the key upside barrier.
USD/CAD daily chart
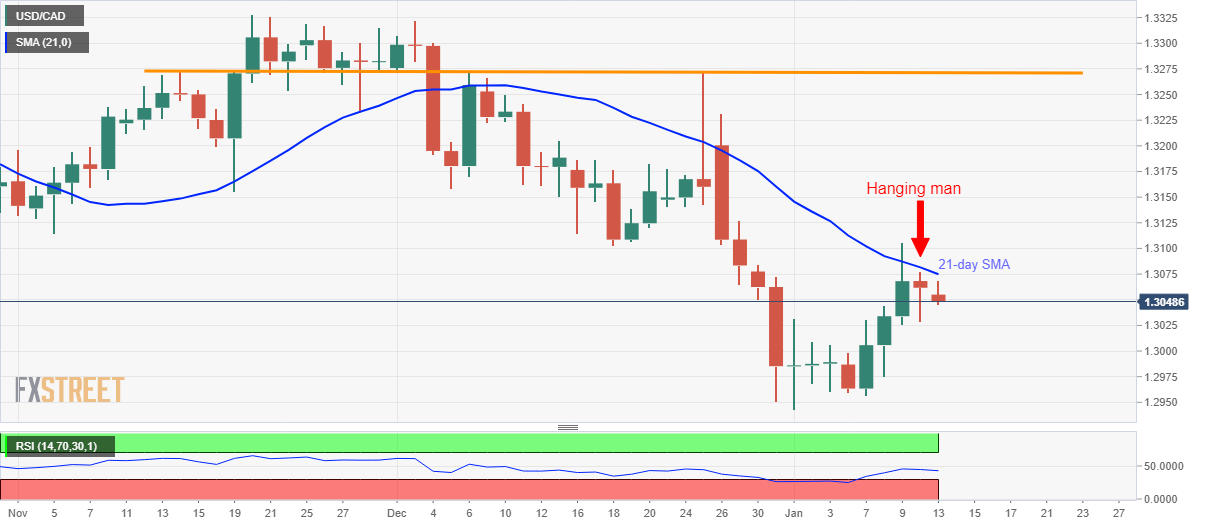
Trend: Bearish